Gantt Chart Excel Template
What is a Gantt Chart?
A Gantt Chart is a visual representation of project tasks against a timeline. Microsoft Excel Gantt Chart allows a project manager to visualize different stages in a project and how the phases or tasks are planned against a timeline. A Gantt Chart could be a simple task vs. time representation or a complex representation that shows tasks, resources, dependencies, and critical path. The chart was invented by Henry Gantt and is named in his honor (Gantt isn’t an acronym).
Gantt Chart Excel Template
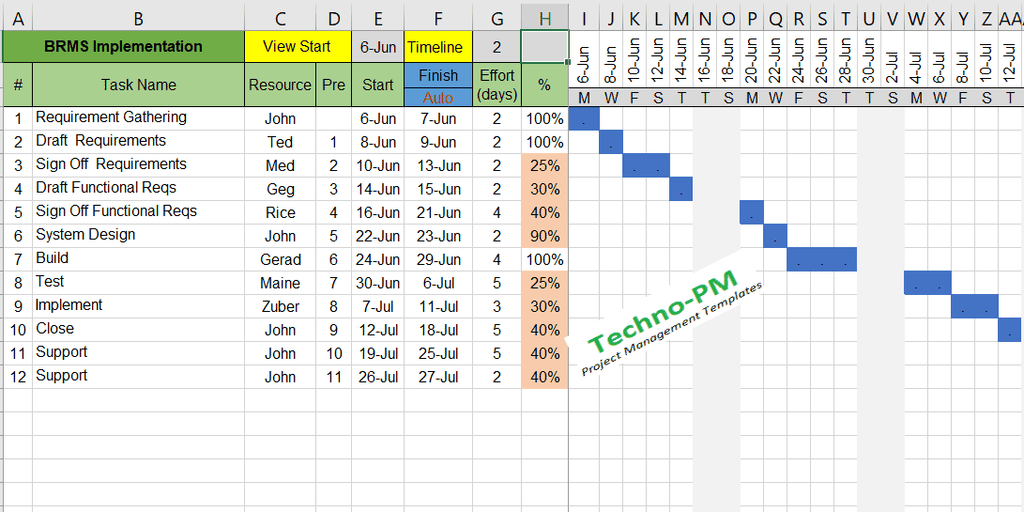
The Excel Gantt chart template allows users to enter the start date of the view. The timeline for the Gantt chart can be adjusted. You can view the timeline for 1, 2, or 5 days or even more. Typically, when planning, you need a detailed view, but you need a holistic view once planning is complete. Allows use of predecessors for tasks - this feature allows you to capture task dependencies. Auto calculates end dates for tasks based on start date and effort.
When creating a task, always copy-paste the existing tasks so that the conditional formatting also gets copied to the new task. You can change the color of the Gantt by changing the conditional formatting options.
Advantages and Disadvantages of Gantt Chart
Disadvantages - Many different varieties of charts are used, which can confuse people (an example is above). Not suitable for high-level management as it can get very detailed. Tools often lack the functionality to view and print large Gantt charts. Often need to be supplemented with additional data or tables for task information.
Best Practices when working with Gantt Charts
Always include task dependencies and predecessors in the project plans. Ensure that you consider account for holidays and major leave plans. Using different colors for different phases can make the Gantt Chart more readable. If the plan is a tool complex, add high-level project phases of tasks. Mention the key milestones or tasks in the plan as separate tasks. Document the tasks in chunks of slots of up to 5 days, as making them more granular can make the chart unreadable.
Always store the previous copies of the updates for comparison. It’s a good idea to store the copy with a date prefix (Gantt_Plan_12-Feb-2016.xlsx). Before publishing the final version, it’s good to get peer reviews and/or do a dry run with your manager. When publishing, check to ensure all the readers have the tool or publish using a PDF format. Always include some amount of contingency in the tasks which have cross-dependency.