


Project Risk Dashboard Template
Introduction
A project risk dashboard is a visual tool that provides a comprehensive overview of the risks associated with a specific project. It is designed to help project managers and stakeholders monitor, track, and assess potential risks throughout the project lifecycle.
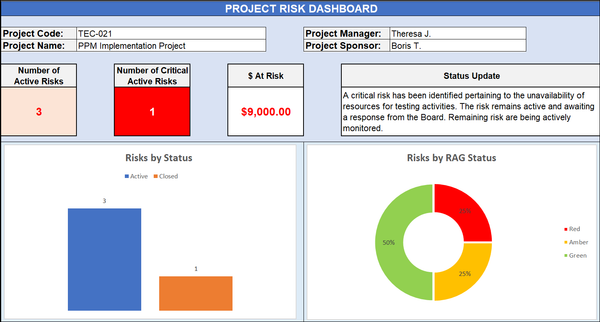
The project risk dashboard displays vital risk metrics, such as the likelihood of occurrence, the impact on project goals, the severity of the risk, and the risk rating. It also includes visual representations, such as charts and graphs, to present the information clearly and easily understandable.
Benefits of a Project Risk Dashboard
- Risk Identification and Prioritization: The dashboard lets stakeholders quickly identify all the risks associated with the project. By having a centralized view, it becomes easier to prioritize risks based on their potential impact and likelihood.
- Real-Time Status Updates: The dashboard provides real-time updates on the status of each risk. This ensures that all stakeholders are aware of the current state of the risks and allows for timely decision-making and risk response actions.
- RAG (Red, Amber, Green) Status: RAG status (colour-coding system) enables stakeholders to assess the severity of each risk briefly. Red indicates high-risk items, amber for medium-risk, and green for low-risk, helping stakeholders focus on critical issues.
- Category-wise Risk Analysis: Grouping risks by categories (e.g., technical, financial, organizational) allows stakeholders to understand which aspects of the project are most susceptible to risks. This information can aid in targeted risk mitigation strategies.
Key Components of a Project Risk Dashboard :
A project risk dashboard is designed to provide a comprehensive overview of the project's risks and their relevant details. The critical components of a project risk dashboard typically include the following:
- Risk Category: This component categorizes risks based on their nature or type. Categorizing risks helps stakeholders to identify common patterns and address them with targeted mitigation strategies.
- Cost Exposure: For each risk, the cost exposure component quantifies the potential financial impact on the project if the risk materializes. It helps prioritize risks based on their potential cost consequences.
- Probability: This component assesses the likelihood of each risk occurring. Risks with higher probabilities may require immediate attention and action.
- Risk Status: The risk status component indicates whether each risk is open, closed, or in progress. It gives an overview of the current state of risk management activities.
- Impact Analysis: This part of the dashboard outlines the potential consequences of each risk materializing. It helps stakeholders understand the effects on project objectives and deliverables.
How To Implement the Project Risk Dashboard?
Implementing a Project Risk Dashboard involves several steps to ensure its effectiveness and successful integration into the project management process. Here's a step-by-step guide to help you implement a Project Risk Dashboard:
- Define Project Objectives and Requirements: Clearly outline the objectives of the project risk dashboard. Understand the specific needs of stakeholders, such as project managers, team members, and senior management. Determine what information they need to manage risks effectively.
- Select the Right Tools and Software: Choose appropriate dashboard software or tools that align with your project management framework and can handle data visualization effectively. Various commercial and open-source dashboard tools can be used to create interactive dashboards.
- Identify Key Risk Metrics and Components: Determine the critical risk metrics and components that should be included in the dashboard. These may include risk categories, probability, impact, RAG status, cost exposure, assigned owners, and risk response plans. Tailor the components to suit your project's unique requirements.
- Gather Data and Risk Information: Collect relevant risk data from project stakeholders, risk assessments, risk registers, and other sources. Ensure the data is accurate, up-to-date, and well-organized for the dashboard.
- Design the Dashboard Interface: Design the dashboard layout, keeping it intuitive and user-friendly. Organize the components logically and use visualization techniques like charts and graphs to present information effectively. Consider using colour coding (e.g., RAG status) for easy identification.
Best Practices for Maintaining the Project Risk Dashboard :
Best Practices for Maintaining the Project Risk Dashboard" addresses the strategies and actions that should be undertaken to ensure the Project Risk Dashboard remains effective and valuable over time. Here's a more detailed explanation:
- Regularly updating risk data: To keep the Project Risk Dashboard relevant and accurate, it's essential to update the risk data regularly. As a project progresses, new risks may emerge, and the severity of existing risks may change. Therefore, project managers and team members should consistently review and refresh the data in the dashboard.
- Reviewing and refining the dashboard as needed: Periodically assess the effectiveness of the dashboard and gather feedback from users, stakeholders, and project team members. Determine if any adjustments or improvements are necessary to enhance its usability and relevance. This process might involve adding or removing specific risk categories, adjusting visualizations, or refining risk descriptions for better clarity.
- Ensuring data accuracy and reliability: Data integrity is crucial for the credibility of the Project Risk Dashboard. Validate the risk data sources and ensure the information is accurate, reliable, and current. Only accurate data can lead to informed decisions, potentially jeopardizing the project's success.
- Engaging stakeholders and team members: Encourage active engagement with the dashboard among all stakeholders and project team members. Regularly share insights from the dashboard with relevant parties to promote a culture of risk awareness and proactive risk management.
- Linking risk mitigation strategies to the dashboard: Directly connect the mitigation and action plans. This way, the corresponding mitigation strategy is readily available when a risk is identified or its severity changes. This linkage ensures that stakeholders and team members have immediate access to the necessary steps to address risks effectively.
- Integrating the dashboard into project management processes: Ensure the Project Risk Dashboard is seamlessly integrated into the overall workflow. It should be a part of regular project status updates, meetings, and risk review sessions. This integration helps embed risk management practices throughout the project lifecycle.
- Providing training and support: Offer training sessions to team members and stakeholders on how to use the Project Risk Dashboard effectively. Ensure everyone understands its functionalities and how to interpret the risk data displayed. Additionally, be available to support and address any questions or concerns about the dashboard's usage.
Conclusion :
In conclusion, a Project Risk Dashboard is a powerful tool that significantly enhancing project risk management. A clear and visual representation of risks empowers project managers and stakeholders to make informed decisions and proactively mitigate potential issues.