


Agile
Agile Dashboard
Agile Dashboard Excel Templates
Excel Dashboard Templates
MS Excel
project dashboard
Agile Dashboard Excel Templates
Agile Project Management Dashboard Excel Download
One of the key challenges for any project manager responsible for an agile project is to report the right picture of the project's progress.
Agile Project Management Dashboard
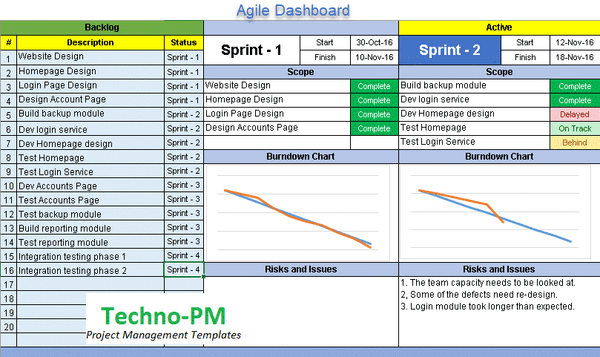
Because of multiple sprints, involved stakeholders may not see a forward view of the project. This dashboard template attempts to address the issue of giving a line of sight for an agile project.
Provides a high-level overview of the backlog and sprints contained in the project. Each sprint captures start, finish, backlog items planned, a burndown chart, and risks/issues.
The Backlog
- Contains the list of items being worked on for the project.
- The backlog has item numbers, descriptions, and Sprint.
- The last column, "Sprint," should have the sprint in which the backlog item works.
- Typical values for that column will be "Sprint 1", "Sprint 2", "Sprint 3" etc.
The Sprints
- Based on the start and finish dates for the sprint, the current sprint is highlighted in blue.
- If you see the above image, sprint 2 is highlighted, which is currently based on the project's system date in Sprint 2.
- Each of the backlog items or tasks can have different statuses - Complete, On Track, Delayed, and Behind.
- Using Complete status when the item is complete and ready to be shipped or released.
- On-track status should be used when everything is as per plan.
- Behind status should be used when the task has slowed down and could potentially get delayed.
- Delayed is when the task is already out and needs more time or additional resources to complete.
Risks and Issues
- The Risks and Issues section for each sprint should report any impediments the project team is facing.
- It is a free-form text update, so you can report a few issues or one issue in detail.
- Examples of a list of issues - 1. The team capacity needs to be looked at. 2, Some of the defects need re-design. 3. Login module took longer than expected.
- Example of one detailed issue - The team had a few unplanned leaves because the module was delayed. The delay has had a knock-on impact on testing as testers will need to wait as there are no other modules ready. This delay will impact the timeline and cost of the project.
Burndown Chart
- Each of the sprints has a burndown chart.
- A burndown chart is a graphical representation of work left to do versus time.
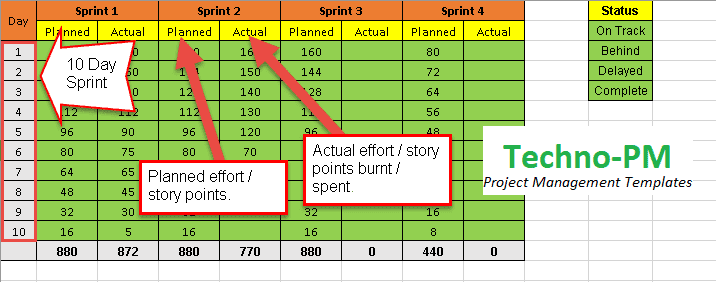
- Data tab captures Planned and Actual effort/story points, which then feeds into the burndown chart.
- Please see the below image for details.
- Each sprint is assumed to be of 10 days. For every sprint, we have planned and actual.
- You can either use work units or story points that you planned vs what was actually achieved in the sprint.
Data for the Dashboard