Project Portfolio Management Template Excel Free Download
Project Portfolio Management
The dashboard template built in excel allows a project manager to provide an effective update on a project portfolio. The dashboard covers the project roadmap, project health, financials, resource allocation, and risk meter.
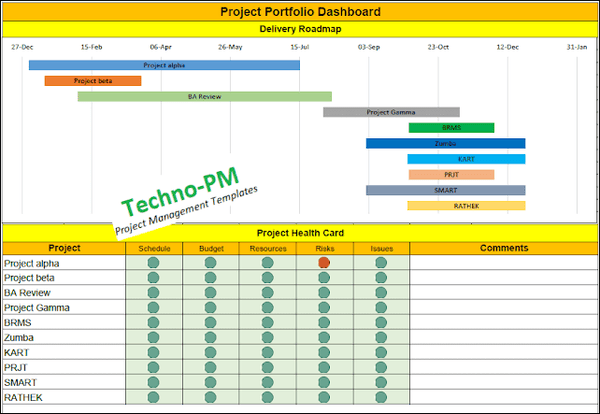
Project Portfolio Dashboard
Project Portfolio Management Template
Features of the Project Portfolio Dashboard Excel Template
- The project portfolio dashboard has a project delivery road map, project health card, financials, resource allocation, project risk meter, and other key parameters.
- Can handle up to 10 projects, and all the data for the projects are defined in a single tab.
- Easy to update project information.
- The timeline or road map can be expanded on collapsed as per the dates. You can use different colors for various projects to make it easy to visualize.
- The project health card covers key project parameters - Schedule, Budget, Resources, Risks, and Issues. Changing the traffic light s very easy enter 1 for green, 2 for amber, and 3 for red.
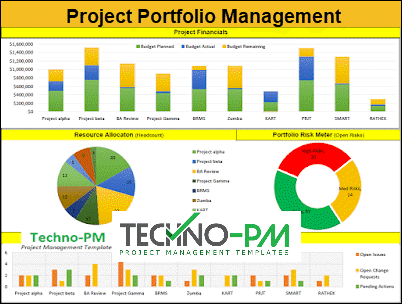
- Project Financials covers Planned Budget, Actual Budget, and Remaining Budget.
- Resource Allocation gives an idea of how many resources are allocated to each project.
- Portfolio Risk Meter displays open risks for high, medium, and low severity.
- Other Key Projects Parameters include open issues, pending change requests, and action items.
How To Use Project Portfolio Dashboard Excel Template
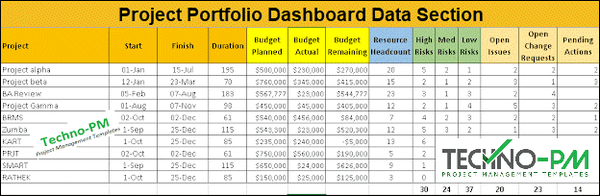
Project Portfolio Dashboard Data Section
- The dashboard is simple to use and can be configured using the data tab.
- Each project can be set a start date and end date.
- Budget Planned, Actual, and Remaining can be set.
- Resource headcount is the number of people working on the project.
- Risks can be captured in terms of high, medium, and low.
- Lastly, no issues, open change requests, and pending actions.
Consider the following - Project Management Dashboard Excel, Free Excel Project Management Templates, Portfolio Dashboard PPT, Excel Project Management Template.