


Gantt Chart Excel
MS Excel
Project Management Templates
Project Tracker
Project Tracker Template
Project Tracking
Project Tracking Template
Project Tracking With Master Excel Project Manager
Project Tracker
Project Tracker is a comprehensive tool designed to streamline project management and enhance team collaboration. With its user-friendly interface and powerful features, Project Tracker simplifies the process of planning, tracking, and organizing projects from start to finish.

Excel Project Management Template
Why We Need The Excel Project Management Template
- It tends to get a bit tiring when you have information spread across so many spreadsheets.
- It's tough to go to all the different spreadsheets and get the information.
- And that is where I have designed this excel project tracking template with different tabs, so there's one tab for schedule, one tab for project budget, resources, risks, actions, change requests, and most of the things a project manager would like to track.
- And with that, it also has a dashboard that gives an overall view of the project.
- It's easy for a project manager to determine the problem areas and what should be focused on.
Features Of The Excel Project Management Template
- The template covers all the key aspects of project management.
- The template has schedule planning, budget tracker, resource management, risks, issues, actions, decisions, and a dashboard.
- The schedule planner has Gantt Chart and Traffic Lights for task tracking.
- Budget Tracker is simple and covers 3 different types of project cost categories.
- The resources tab in the sheet can be used to track resource allocations and related costs.
- Risks, Issues, Actions, Decisions, and Change Requests are lists.
- The excel project tracking template also has a dashboard that gives a high-level view of all the project KPIs.
About The Main Dashboard
- This is the type of dashboard that I personally would like to see when I come to the office.
- In the morning, just open this up and say this is what tasks I want to work on today, or my risks are too much or my issues are too much, and so forth.
- So the first is the Schedule Health graph which tells you how many tasks are on track, delayed or other tasks you should be worried about.
- Then there's the Task Status graph, which tells you the progress of your tasks. Project Budget Health tells you how much was planned, how much was spent, and remaining from your project budget.
- There's Resource Health which gives you a very high-level view of how you are utilizing your resources. Again, open risks and open issues are risks and critical, high, medium, and low.
- Action items, change requests, and pending decisions, these numbers give you an idea of how many items are open.

Project Schedule
Project Schedule Tracking:
- And moving on to the schedule tab, it has a traffic light indicator, task names, and task numbers.
- It's pretty self-explanatory; the resource comes from the resourcing sheet. There's a predecessor column if you want to add a predecessor.
- There's a start that you need to configure, and there's a finish that is auto-calculated. It is based on the start date and effort that you put in.
- There's an effort column. There's an actual column which is the actual progress so far. So this is the data that you should get from your business analyst and anybody working on the project to note the latest progress.
- Then there are the days planned, which again is auto-calculated. So the blue fields are something that isn't auto-calculated.
- The status is green, amber or yellow, and red. So green is when everything is good, yellow, or amber, as we call it is when it's five percent. This is the task that you should be worried about; it slipping, and red is when it's already gone wrong.
- For example, you can look here. These are one hundred percent, most of them are one hundred percent, should be one hundred percent by now, but they are not, and that is why most of them are flagged as red.
- Some are based in July, so they should be fine, and the 15th of June should be okay, so that's how the table works. So you can start your view at the latest time by changing this column. So you say the 1st of June changes the timeline.
- The blue indicator is for today, then the timeline days; you can change it if you want to see the timeline for two days; you can change it for three days or change it back to one.
- I would suggest leaving it for one because that's how the template has been designed, and it works best with a timeline view of one day.
- Another feature is that you can see some of these dates are highlighted in red, so this indicates that these dates fall on a weekend, and you should probably look at your tasks to see if you can move the dates around.
- This tab provides the basics of task management and tracking.
Project Budget Tracking

Project Budget Tracking
- It's a project budget tracking simple spreadsheet; you have different categories here. Resource costs, software, hardware, and other costs.
- If you want to add a cost, you just type it in, and the gray becomes white, and when you enter a number here, you enter a number here.
- So that's pretty easy to use; this is a fundamental but important part of the cost budget.
Project Resource Management
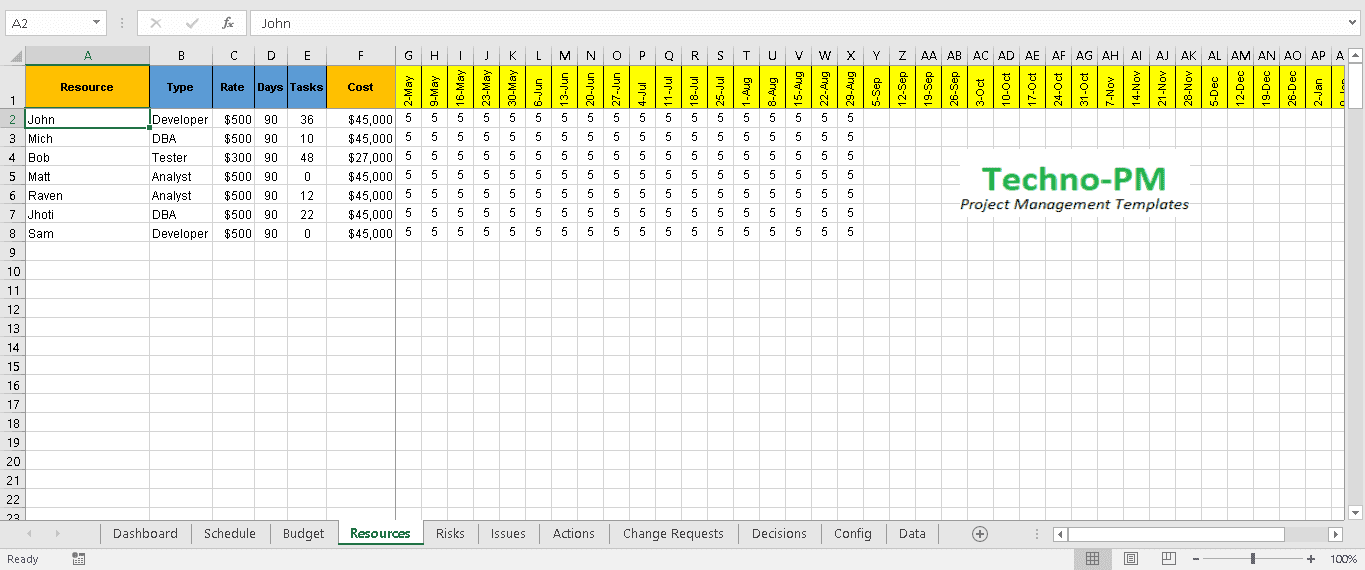
Resource Manager
- The resource sheet allows tracking of resource allocation, and what we're looking at here is a weekly timeline, resource name, the type of resource, what the daily rate is, and how much allocation you have.
- And this field task comes from the schedule that you have. And then, of course, the cost is calculated based on the number of days and the rate.
- There are two things to Project Resource Management. One is you do resource allocation, and then you do your schedule.
- So you do your allocation, and you say, "I want this person from this date to this date," and then you have to make sure as a project manager that you are allocating enough tasks to them.
- For example, if we look at John, you've had him for ninety days, but you allocated the task for only fifty days. If we just go back and filter John, it's pretty clear that it's only fifty-six days.
- So this is where you should probably go and look at his allocation, which the resource feed is meant to do.
- It's meant to give you an idea of where you're not using your resources adequately, and this is where the whole resource health is also drawn from, so that gives you an idea.
Project Risks, Issues, Decisions, and Change Requests

Project Issues
- Risks, issues, actions, change requests, and decisions are pretty much simple spreadsheets, so you just keep adding them.
- Adding items there, and the only thing I suggest you do is once you close an item, you probably just move it down and keep it there for some time, and then you can move it out of your list, so you know what you have closed recently.
Project Config and Data

Project Config and Data
- The configure section is where you configure your holidays.
- You also have severity, priority status, risk rating, and approval. I would highly recommend not changing this because there are many numbers written on this, and it might mess up the dashboard a bit.
- But if you have to absolutely do it, you should, and then I would suggest looking at changing the others. You can change the resource type or leave it as it is, but just make sure you change it across the board.
- The data, there is nothing to be changed here; this is just some background calculations that I need for the dashboard. So that's it guys, thanks for listening, and let me know if you have questions.