


Project Dashboard Templates: 10 Samples in Excel and PPT Free Download
Project Dashboards
Project dashboards serve as centralized visual summaries of key project metrics, performance indicators, and progress updates. They offer real-time insights into various aspects of a project's status, allowing stakeholders to quickly grasp the project's health and performance at a glance.

Project Dashboard Excel Template
We recommend the following dashboards for single projects - Project Dashboard Template in PPT, Dashboard with Heatmap dashboard for Project Management, and Agile Project Management Dashboard with Excel.
We recommend the following dashboards for multiple or portfolio of projects - Portfolio Management Dashboard Excel, Multiple Project Portfolio PPT, Executive Portfolio Dashboard, and Multiple Project Tracking Template Dashboard.
Advantages and Features of the Project Dashboard Excel Template
- The excel project dashboard gives a birds-eye view of the critical parameters and their status using graphs and timelines, making management easy. The senior management always wants to have a quick overview rather than a detailed analysis.
- Has a commentary section that can be used to enter a free-form update. This should be short and crisp and should give a clear message to the management. The project dashboard has an overall project status indicator that can set the dashboard's overall project status.
- Displays the schedule as a timeline which makes it easy to visualize the schedule. It is easier to understand the timeline as it is like a Gantt chart. The schedule should be used to display only the high-level phases.
- Also displayed are the task details. The details include tasks on track, delayed, and not started. This information will help the management in understanding how many tasks are pending.
- The dashboard also tracks the budget on a month by monthly basis, which makes it easy to access if the budget is still on track. Displaying the project budget in a monthly fashion allows natural interpretation of the budget is tracking. Budget is one of the critical parameters for senior management.
- Display the total count for risks and issues, which again allows the management to focus on the areas where there are problems. For both risks and issues, the total number of High, Medium, and Low.
- The dashboard also displays decisions, actions, and change requests pending. This information helps the management in understanding what items are pending.
- Easy to configure and use as it is excel based. As it is in excel, it can easily be email or shared with someone. And it is absolutely FREE. Feel free to edit the template to create your own excel template.
Disadvantages of the Project Dashboard Excel Template
- As it is a separate document, the dashboard is not linked to the project plan and will need manual data entry. In a busy management schedule, this task can be overheard.
- The scheduled timeline can be complicated to change if you want to add additional tasks.
- The recommendation is to limit the number of tasks in the timeline. Limit to displaying only high-level timeline tasks. Deleting the tasks is easy.
How to Use the Project Dashboard Excel Template
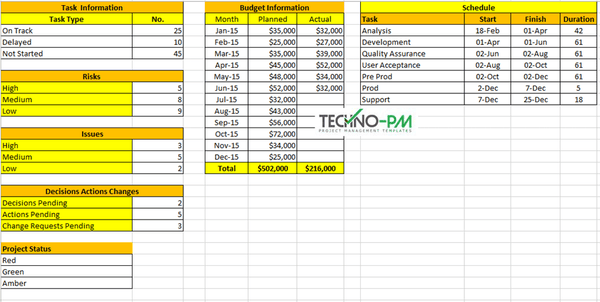
Data Entry Tab
1. The excel spreadsheet has two tabs - dashboard and data.
2. The dashboard sheet has the actual status with a timeline and graphs. Data has all the fields to be entered so that the graphs work on the dashboard.
3. The datasheet has a Schedule section which task name, start, end and duration. The duration is auto-calculated. The schedule should be high-level rather than details.
4. The Task Information has the number of tasks On the track, Delayed and Not started. You should be able to get this information from your plan.
5. Budget Information - Should contain the budget every month. There are two columns, planned and actual.
6. Risks and Issues contain a count for High, Medium, and Low risks and issues.
7. Decisions, Actions, and Change requests have information about pending decisions, actions, and change requests.
8. Status can be used to configure the project status you want to see on the dashboard. Suggested from Techno-PM - Consider using detailed Project Status Reports.