


MS Project Tutorial For Generating Reports : How To Create Reports And Dashboards
Microsoft Project Report
Microsoft Project 2013 has some fantastic options for generating reports. There are a lot of default or MS Project template reports which you can generate in a click. I will let you explore those on your own in this tutorial we will talk only about customization of reports.
MS Project Reports can seem to be complex when you look at it for the first time but once you understand the concepts and get your basics right you will be able to use the reports a lot easier. To make the tutorial more effective it is divided into 3 steps. First step - Creating the custom reports, will discuss how you can create reports and the basics about reporting. Second step - Configuration of the reports and step three - generation of the reports.
MS Project Tutorial for Generating Reports
How To Create A New Custom Reports In MS Project ?
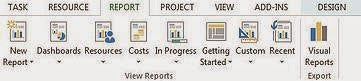
Clicking on the New Report option will give you a few choices. I prefer the option with the Chart as we do not plan to use any table today. You should see the view as per the image above. Notice the columns to the right. Please save the report as Sample.
The fields option in Microsoft Project Reports is the most important setting as the setting in this column will drive your reports. You basically have two views - Tasks and Resources. It is very similar to pivot tables used in excel.
MS Project Report Options
Clicking on tasks will show you the attributes associated (task name, duration, work etc) with tasks and clicking on resources will show attributes (resource name, work, and remaining availability) related to a resource.
There is a bit of overlap in the fields but you will not be able to get a full overlap. You can select a category of data you want to display. There are a few categories in both the views. One of the key category is time. The time option allows reporting based on a time. So, you can display the effort spend over days, weeks, months, years etc in your report.

How To Configure A Report In MS Project ?
After you have got the basic microsoft project report template ready you can then add different graphs or tables to the report depending on your need. In this section we will look at adding a new chart, using the time option and formatting the graphs. You can add a graph by using Chart option from the design tab. If you don’t see the design tab then click one of the already build chart as the design tab is context sensitive.
Microsoft Project 2013 gives you a vast range of graph templates which you can choose from - column, pie, line, bar, area, surface, radar, and combo. It is pretty much everything that MS Excel provides. I mostly use column or pie as it is easy for people to understand. As mentioned earlier the time option lets you select the duration of the time to be reported. The units are whether you want to see weeks, months or years etc. The date format you like to see.
Microsoft Project Report Timescale
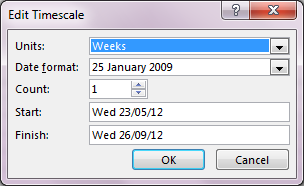
Count defines the count for each unit. If the units are weeks and count is 2 then the report will populate data at the interval of two weeks. Start and Finish are the start and end dates. You don't have to be exact when selecting dates. You can enter rough dates and MS Project 2013 will pick the nearest dates. Microsoft Project 2013 also provides a wide range of formatting capabilities in the design tab.
The options allow to changing the basic format like color, font, legends etc. You can also change the chart type whenever you wish to see different views. You can change the chart background color. There are some default formats and report templates that are pretty savvy and can be used without any tutorials. You can also add new chart elements like legends, titles and you can also apply filters to the data used. The options can be found in the design tab or are displayed when you hover your mouse over the chart.
How To Run A Custom Report In MS Project ?
When running a project I like to know how much work is the project delivering, how much is each team member delivering, how much work are we doing in each phase and finally is there any excess capacity. And the good news is that Microsoft Project 2013 allows you to generate an all the reports in a click.
We will now see how we can generate Team Workload Report, Work on Month by Month basis, Task Effort and Excess capacity. We will create all of them on the sample report by adding 4 distinct graphs by the method described in step 2.
MS Project Tutorial
You can generate the Team workload report by selecting the task view, category as "Name" and in the select fields column select work field from the work option. You can generate the team Work on Month-by-Month report basis by selecting the resource view, category as time (monthly interval) and work field from the work options.
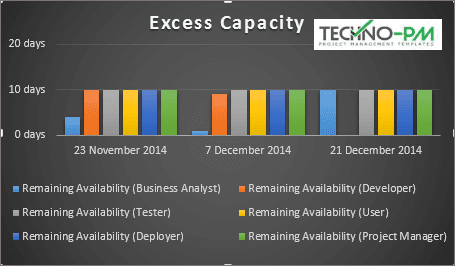
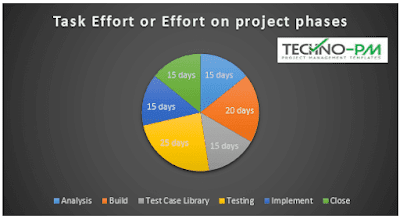
You can generate the Task Effort or Effort on Project Phases by selecting the tasks view, category as name and work field from the work options. You can generate the Excess Capacity Report by selecting the resources view and then selecting the time category.
I prefer selecting weeks and have the total duration of roughly one month as I prefer to see the free capacity for next month. Select the Remaining Availability from work option. Finally, after creating all the above graphs by following the tutorial you can save the Sample.
The advantage is that the next time you need these MS Project Reports you will have to go to Reports --> Custom Reports and select the one that you created and it will be rendered instantly. You can also use the copy report option in the design tab to copy the output to the clipboard and then to any other document or email you want. This option is handy when you want to paste from Microsoft Project to another application. If you like this tutorial then please share it with your friends and your colleagues.

MS Project Sample Report
Resource Management Dashboard With MS Project Reports
We will assume we have a common resource pool and master project plan which includes all the three projects. It is recommended that you read the below articles before you proceed with creating the reports.
Step 1: Create Filters And Groups For Resources
This is the most important step as it will lay the foundation for the dashboard to be generated. You will need to create one filter each for the teams and a group on Resource Groups. You will need an IT Team, Legal Team, OPS Team, and Services Team filter. Also, a group based on Resources Group and Resource Name. Please see the below articles on how to add filters and groups.
Step 2: Creating The Dashboard Reports
We will now look at how we can create 3 different sets of reports for resource management dashboard. Team Work Load Report - A report which will provide a view of the team workload. Resource Allocation Report - This report will help in understanding how the resources are allocated. Resource Availability Report - This report will show if any resources are available.
Step 3: Team Work Load Reports
To add the team workload dashboard click on Design and add a new Chart. Select the type of report you need to use. And select the fields as shown to the image to the right to see the report which is based on resource groups. The report will be based on the group that you select. You can add formatting options by right-clicking on the report. You can add legends, chart titles, data values etc.
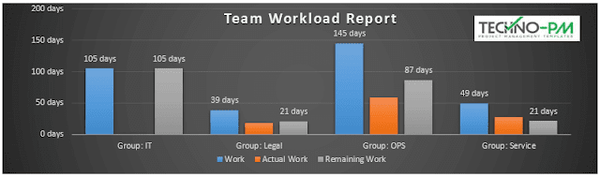
Team Workload Report
Step 4: Resource Allocation Report - Entire Resource Pool
The resource allocation report on the dashboard will give a view of how much work each resource has been assigned. Two values are shown for each resource - Work and Remaining Work. Work is the work assigned and the remaining work is the work still remaining. This report will help a project manager in deciding if any of the resources are overloaded. Select the fields as shown in the image to the left. The key is to select the options right as that will decide what is displayed on the report.
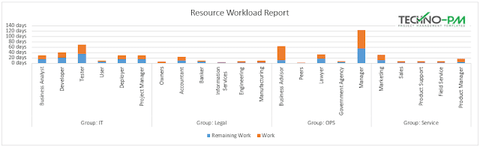
Resource Workload Report
Team Work Load Report
Step 5: Resource Allocation Report - Time-phased Report For Individual Teams
The above report on the dashboard gives you a good idea about how all the resources are allocated. The report is a very high-level report and does not tell you when the resource is free. To find out when the resource is free we will use the Time option. Also, remember that if you try to do this with the entire resource pool the report or the chart might get very big and become difficult to read. In this example, I have used the IT Team filter and the group by Resource Name which will group the data by resource names.
Resource Allocation Report
The First report on the dashboard below gives a picture of the availability of resource times. Second Report the Work Allocated gives an idea about how much work each resource has been allocated. The second report is generated with all the same selections as field dialog expect the field to be displayed is the Work Assigned. Comparing both the graphs will give a project manager a clear picture about the resource allocations. One of the settings is the time phase. The time phase can be selected by clicking on Edit beside them in the Fields options box. Clicking on edit will open the Edit Timescale dialog. Units will be the duration, in this case, it is months, count the number of units(2 months, week etc) then Start and Finish Date.
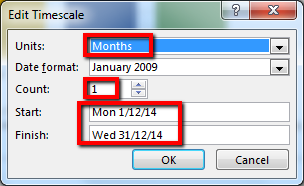
Time Phase Settings
Report Config
Step 6: Resource Availability Report
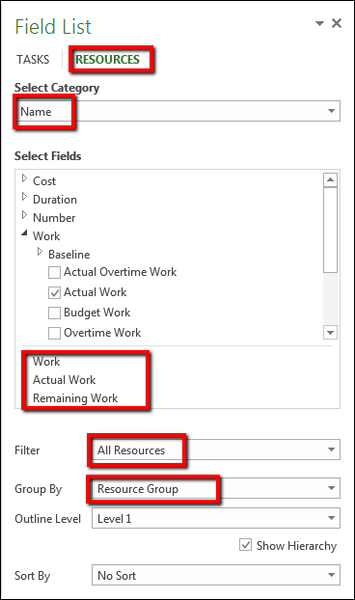
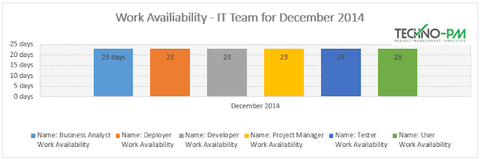
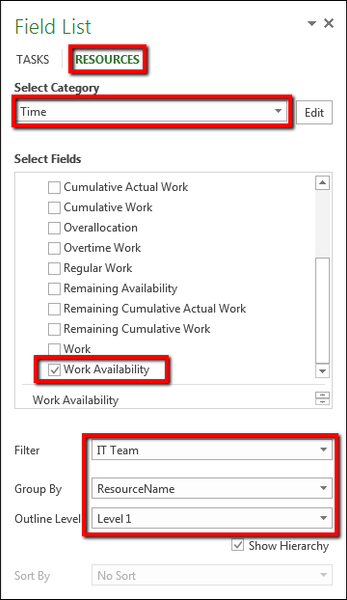
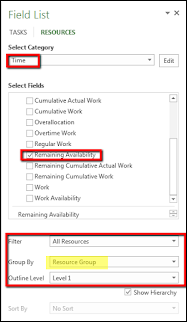
This is one of the key reports on the dashboard as most of the managers and senior management are interested in finding out which resources are available. We will look at two versions of the report - one at the team level and one at resource pool level. The first report can be generated with the same options as above Resource Allocation report with the only difference being the display field selected as Remaining Availability. The second report can be generated by selecting the options as shown in the image to the right. The key difference would be to select All Resources and then group by Resource Group.
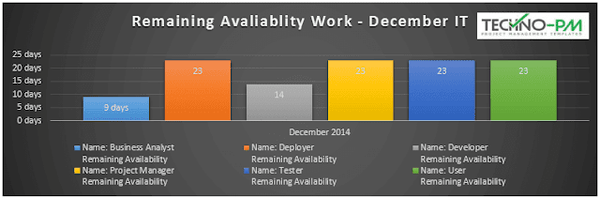
Resource Availability Report
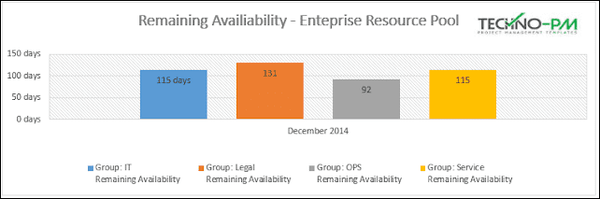
Resource Availability Report
Multiple Project Dashboard With MS Project Reports
I understand that there are several tools available for Project Portfolio Management (PPM) which can do this task. But the focus of this article will be to enable someone using Microsoft Project to report on multiple projects. The Project Portfolio Dashboard will have 4 sections: Project Progress Card, Project Work Load, Budget Overview, and Upcoming Milestones. This technique is based on the assumption that you have a Master Project Plan for all your projects.
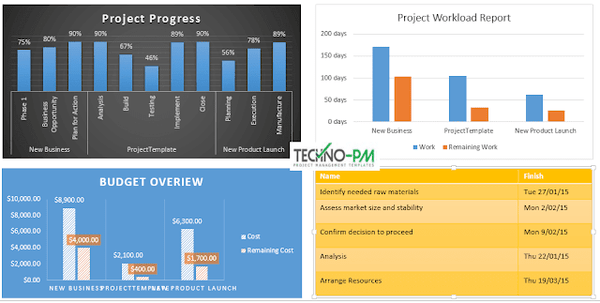
Multiple Project Dashboard
If you need to know how to set up a Master Project plan please read my article on How to create a Master Project plan in Microsoft Project. I would also recommend that you set up a resource pool with a Master Project so that you can report on all your resource as well. Please see my article How to Create a Resource Pool with Microsoft Project to understand how you can create a resource pool. I am using a Master Project Plan with 3 projects - New Business, Project Template, and New Product Launch.
Microsoft Project allows customization of reports which you can use to suit your needs. Create a new custom report by going to the Reports Tab in Microsoft Project and click on New Report and then select a blank report. You will be asked a Report Name please enter a suitable report name.
Project Progress Report
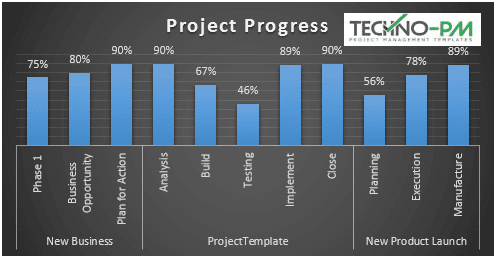
Project Progress Report MS Project
Please click on the chart(Add Chart) from the ribbon and select a column chart. The project progress report will show the % complete. In the fields section please select only % Complete under Numbers.
Please delete all the other fields. In the filter drop down select All Tasks, select Level 2 in Outline Level 2. Check the Show Hierarchy option. Please move this to the right side of the report.
Project Workload Report
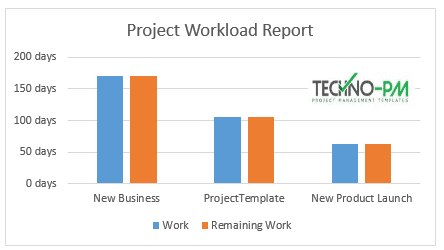
Project Workload Report
Please click on the chart(Add Chart) from the ribbon and select a column chart. After the graph is created you should be able to see all the projects names present in the master project plan. You can remove all the fields except Work and Remaining Work. Please move this graph to the right side of the report.
Budget Overview
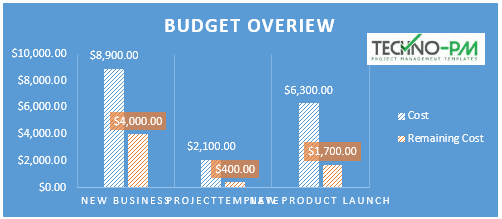
Project Budget Overview
The budget overview will give everyone an idea of the project budgets. Please click on the Chart(Add Chart) from the ribbon and select a column chart. The graph will have the budget total cost (cost) and remaining cost. I have used the column chart. You can select the report format under the design tab. Select the Cost and Remaining Cost under the Cost option. Delete the other fields from the fields list.
Upcoming Milestones
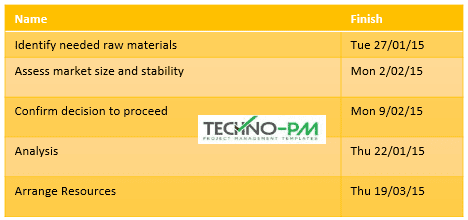
Project Milestones
The milestones table will display the milestones in all the projects within the master project plan. To add a table click on Table in the design tab. The key step is to select Milestones in the Filter drop down so that the table shows only the Milestone tasks. By default, a few columns will be added. Please remove all the columns except Name and Finish Date. For Filter drop down select Milestones, Group should be No Group, Outline Level should be All Subtasks. You can select the table format under Design Tab which appears under Table Design.
Generating The Multiple Project Status Dashboard
Generating the report is the easiest task. After adding all the above graphs and tables please save the report. The report will be available under the Custom Reports in the Reports tab. Whenever you need to generate the report you need click on the report name under Custom Reports and the report will be generated in a click. Using the Copy Report option under the Design Tab you can copy your report to your presentation/dashboards and any other document.